1.0 Check the basic settings and firewall states
Check the system status
to see the actual software version, operational mode, HA, etc and the system time:
myfirewall1 # get sys status
Version: Fortigate-50B v4.0,build0535,120511 (MR3 Patch 7)
Virus-DB: 14.00000(2011-08-24 17:17)
Extended DB: 14.00000(2011-08-24 17:09)
IPS-DB: 3.00150(2012-02-15 23:15)
FortiClient application signature package: 1.529(2012-10-09 10:00)
Serial-Number: FGT50B1234567890
BIOS version: 04000010
Log hard disk: Not available
Hostname: myfirewall1
Operation Mode: NAT
Current virtual domain: root
Max number of virtual domains: 10
Virtual domains status: 1 in NAT mode, 0 in TP mode
Virtual domain configuration: disable
FIPS-CC mode: disable
Current HA mode: standalone
Distribution: International
Branch point: 234
Release Version Information: MR3 Patch 7
System time: Thu Nov 15 13:12:30 2012
|
to see what the firewall has seen so far, the traffic mix:
myfirewall1 # get system performance firewall statistics
getting traffic statistics...
Browsing: 544083 packets, 80679942 bytes
DNS: 19333 packets, 2400831 bytes
E-Mail: 52 packets, 3132 bytes
FTP: 0 packets, 0 bytes
Gaming: 0 packets, 0 bytes
IM: 0 packets, 0 bytes
Newsgroups: 0 packets, 0 bytes
P2P: 0 packets, 0 bytes
Streaming: 0 packets, 0 bytes
TFTP: 0 packets, 0 bytes
VoIP: 0 packets, 0 bytes
Generic TCP: 13460 packets, 1301879 bytes
Generic UDP: 7056 packets, 647156 bytes
Generic ICMP: 172 packets, 11804 bytes
Generic IP: 26 packets, 832 bytes
|
Check the hardware performance
to see what is the state of the cpu and the uptime:
myfirewall1 # get system performance status
CPU states: 0% user 0% system 0% nice 100% idle
CPU0 states: 0% user 0% system 0% nice 100% idle
Memory states: 48% used
Average network usage: 1 kbps in 1 minute, 0 kbps in 10 minutes, 0 kbps in 30 minutes
Average sessions: 0 sessions in 1 minute, 0 sessions in 10 minutes, 0 sessions in 30 minutes
Average session setup rate: 0 sessions per second in last 1 minute, 0 sessions per second in last 10 minutes, 0 sessions per second in last 30 minutes
Virus caught: 0 total in 1 minute
IPS attacks blocked: 0 total in 1 minute
Uptime: 24 days,  11 hours,  25 minutes
|
to see the high cpu eaters, in case of high cpu usage:
myfirewall1 # get system performance top
Run Time:  24 days, 11 hours and 26 minutes
0U, 0S, 100I; 249T, 119F, 60KF
 initXXXXXXXXXXX        1      S       0.0     4.5
         cmdbsvr       23      S       0.0     6.8
  zebos_launcher       27      S       0.0     4.7
         uploadd       28      S       0.0     4.6
         miglogd       29      S       0.0     5.9
         miglogd       30      S       0.0     4.6
          httpsd       31      S       0.0     7.0
             nsm       32      S       0.0     1.1
            ripd       33      S       0.0     0.9
          ripngd       34      S       0.0     0.9
           ospfd       35      S       0.0     0.9
          proxyd       36      S       0.0     4.6
       wad_diskd       37      S       0.0     4.6
       scanunitd       38      S <     0.0     4.9
          ospf6d       39      S       0.0     0.9
            bgpd       40      S       0.0     1.0
           isisd       41      S       0.0     0.9
   proxyacceptor       42      S       0.0     0.7
     proxyworker       43      S       0.0     1.8
           getty       44      S <     0.0     4.6
|
Check the High Availability state
to get the High Availability state info with get command:
myfirewall1 # get sys ha status
Model: 311
Mode: a-p
Group: 0
Debug: 0
ses_pickup: enable
Master:254 myfirewall1 FG311B1111111111 0
Slave :128 myfirewall2 FG311B1111111112 1
number of vcluster: 1
vcluster 1: work 10.0.0.1
Master:0 FG311B1111111111
Slave :1 FG311B1111111112
|
with show command the configuration:
(it is worth use the full-configuration to see all the default settings)
In the example I set the followings:
- the hearbeat goes on port5 and with backup on port6
- stateful failover is enabled
- the priority in Ha for this cluster unit (The fortigate has a default setting for priority, there will be only one master if you do not set it on the cluster members. This is cool.)
- and the monitored ports: port4, port6, port6
myfirewall1 # show full-configuration system ha
config system ha
    set group-id 0
    set group-name "FGT-HA"
    set mode a-p
    set password ENC
    set hbdev "port5" 20 "port6" 10
    set route-ttl 10
    set route-wait 0
    set route-hold 10
    set sync-config enable
    set encryption disable
    set authentication disable
    set hb-interval 2
    set hb-lost-threshold 6
    set helo-holddown 20
    set arps 5
    set arps-interval 8
    set session-pickup enable
    set link-failed-signal disable
    set uninterruptable-upgrade enable
    set vcluster2 disable
    set override enable
    set priority 254
    set monitor "port4" "port5" "port6"
    unset pingserver-monitor-interface
    set pingserver-failover-threshold 0
    set pingserver-flip-timeout 60
end
|
with the diagnose command the state again:
myfirewall1 # diagnose sys ha status
HA information
Statistics
        traffic.local = s:2096712 p:2541238162 b:1972123729708
        traffic.total = s:9497465 p:2541238496 b:1972123977459
        activity.fdb = c:0 q:0

Model=311, Mode=2 Group=0 Debug=0
nvcluster=1, ses_pickup=1
HA group member information: is_manage_master=1.
FG311B1111111111, 0. Master:254 myfirewall1
FG311B1111111112, 1. Slave:128 myfirewall2

vcluster 1, state=work, master_ip=10.0.0.1, master_id=0:
FG311B1111111111, 0. Master:254 myfirewall1(prio=0, rev=0)
FG311B1111111112, 1. Slave:128 myfirewall2(prio=1, rev=1)
|
The secondary cluster unit is off:
myfirewall1 # diagnose sys ha status
HA information
Statistics
        traffic.local = s:286117 p:7759897825 b:3064522035872
        traffic.total = s:205341071 p:7759897825 b:3064522035872
        activity.fdb  = c:0 q:0

Model=300, Mode=2 Group=0 Debug=0
nvcluster=1, ses_pickup=1

HA group member information: is_manage_master=1.
FG300A3907506630, 0. Master:254 myfirewall1

vcluster 1, state=work, master_ip=10.0.0.1, master_id=0:
FG300A3907506630, 0. Master:254 myfirewall1(prio=0, rev=0)
|
Check the session table of the firewall
the values from the session table of the firewall (the max against the used):
myfirewall1 # diag sys session full-stat
session table:           table_size=65536 max_depth=1 used=2
expect session table:    table_size=1024 max_depth=0 used=0
misc info:       session_count=1 setup_rate=0 exp_count=0 clash=0
        memory_tension_drop=0 ephemeral=0/16368 removeable=0  ha_scan=0
delete=0, flush=0, dev_down=0/0
TCP sessions:
         1 in ESTABLISHED state
firewall error stat:
error1=00000000
error2=00000000
error3=00000000
error4=00000000
tt=00000000
cont=00000000
ids_recv=00000000
url_recv=00000000
av_recv=00000000
fqdn_count=00000000
tcp reset stat:
        syncqf=0 acceptqf=0 no-listener=11025 data=0 ses=0 ips=0
|
Check the sessions
The following list has only one session, that may be a DNS request from 192.168.227.97 to .the dns server 65.39.139.53.
Do not use this command on live system with many traffic, it lists all sessions and that has no sence.
myfirewall # diag sys session list
session info: proto=17 proto_state=01 duration=2214 expire=123 timeout=0 flags=00000000 sockflag=00000000 sockport=0 av_idx=0 use=3
origin-shaper=
reply-shaper=
per_ip_shaper=
ha_id=0 hakey=28310
policy_dir=0 tunnel=/
state=local
statistic(bytes/packets/allow_err): org=5095/76/1 reply=8757/75/1 tuples=2
orgin->sink: org out->post, reply pre->in dev=10->12/12->10 gwy=0.0.0.0/192.168.227.97
hook=out dir=org act=noop 192.168.227.97:54223->65.39.139.53:53(0.0.0.0:0)
hook=in dir=reply act=noop 65.39.139.53:53->192.168.227.97:54223(0.0.0.0:0)
misc=0 policy_id=0 auth_info=0 chk_client_info=0 vd=0 serial=0047c5b4 tos=ff/ff imp2p=0 app=0
dd_type=0 dd_rule_id=0
total session 7
|
You can filter to the session that you looking for (example):
myfirewall1 # diagnose sys session filter src 192.168.227.129
myfirewall1 # diag sys session list
…
|
2.0 Check the interface settings
Check the state, speed and duplexity an IP of the interfaces
myfirewall1 # get system interface physical
== [onboard]
        ==[internal]
                mode: static
                ip: 192.168.224.65 255.255.255.224
                ipv6: ::/0
                status: up
                speed: 100Mbps (Duplex: full)
        ==[wan1]
                mode: static
                ip: 3.3.3.3 255.255.254.0
                ipv6: ::/0
                status: up
                speed: 100Mbps (Duplex: full)
        ==[wan2]
                mode: static
                ip: 0.0.0.0 0.0.0.0
                ipv6: ::/0
                status: down
                speed: n/a
        ==[modem]
                mode: pppoe
                ip: 0.0.0.0 0.0.0.0
                ipv6: ::/0
                status: down
                speed: n/a
|
Check the MAC and the state of the interfaces. The name of the interface in the example below is internal.
Here you can see following in the output
- Interface name
– MAC
– Link state
– Speed
– Duplex
– MTU
– Packet and Byte counters
– Errors
myfirewall1 # diagnose hardware deviceinfo nic internal
Description                     ip175c-vdev
Part_Number                     N/A
Driver_Name                     ip175c
Driver_Version                  1.01
System_Device_Name              internal
Current_HWaddr                  00:09:0f:d6:c0:ac
Permanent_HWaddr                00:09:0f:d6:c0:ac
Link                            up
Speed                           100
Duplex                          full
State                           up  (0x00001003)
Port_no                         -1
Port_Bits                       0x7
Link_Bits                       0x1
MTU_Size                        1500
Rx_Packets                      694
Tx_Packets                      4
Rx_Bytes                        80348
Tx_Bytes                        214
Rx_Errors                       0
Tx_Errors                       0
Rx_Dropped                      0
Tx_Dropped                      0
Multicast                       0
Collisions                      0
Rx_Length_Errors                0
Rx_Over_Errors                  0
Rx_CRC_Errors                   0
Rx_Frame_Errors                 0
Rx_FIFO_Errors                  0
Rx_Missed_Errors                0
Tx_Aborted_Errors               0
Tx_Carrier_Errors               0
Tx_FIFO_Errors                  0
Tx_Heartbeat_Errors             0
Tx_Window_Errors                0
|
Check the ARP Table
This contains the permanent and the dynamic ARP entries
myfirewall1 # get system arp
Address           Age(min)   Hardware Addr      Interface
4.4.4.66   0          00:08:da:52:33:b6  port4
4.4.4.74   16         00:21:9b:94:38:44  port2
4.4.4.131   0          00:00:0c:07:ac:23  port6
4.4.4.150   1          00:09:0f:09:01:3b  port6
4.4.3.3    0          02:00:5e:47:c1:a3  port5
|
3.0 Check the Routing Table
In this example we route everything through a vpn tunnel, called fortigw-311b:
myfirewall1 # get router info routing-table all
Codes: K - kernel, C - connected, S - static, R - RIP, B - BGP
       O - OSPF, IA - OSPF inter area
       N1 - OSPF NSSA external type 1, N2 - OSPF NSSA external type 2
       E1 - OSPF external type 1, E2 - OSPF external type 2
       i - IS-IS, L1 - IS-IS level-1, L2 - IS-IS level-2, ia - IS-IS inter area
       * - candidate default

S*      0.0.0.0/0 [5/0] is directly connected, fortigw-311b
S       10.0.0.0/8 [10/0] via 3.3.3.1, wan1
C       3.3.3.0/23 is directly connected, wan1
S       4.4.3.48/32 [10/0] via 3.3.3.1, wan1
S       4.4.3.66/32 [10/0] via 3.3.3.1, wan1, [0/50]
C       192.168.223.17/32 is directly connected, gre1
C       192.168.223.18/32 is directly connected, gre1
C       192.168.224.64/27 is directly connected, internal
|
Check the matching route
Are you looking for a spesific route in a big database? No problem use the details:
myfirewall1 # get router info routing-table details 10.20.100.10
Routing entry for 10.0.0.0/8
  Known via "static", distance 10, metric 0, best
  * 3.3.3.1, via wan1
|
4.0 VPN Troubleshooting
The most significant part for vpn is the time on the devices. The check the time use the following command:
myfirewall1 # get sys status
Version: Fortigate-50B v4.0,build0632,120705 (MR3 Patch 8)
Virus-DB: 14.00000(2011-08-24 17:17)
Extended DB: 14.00000(2011-08-24 17:09)
IPS-DB: 3.00150(2012-02-15 23:15)
FortiClient application signature package: 1.131(2012-07-05 20:54)
Serial-Number: FGT50B1234567891
BIOS version: 04000010
Log hard disk: Not available
Hostname: myfirewall1
Operation Mode: NAT
Current virtual domain: root
Max number of virtual domains: 10
Virtual domains status: 1 in NAT mode, 0 in TP mode
Virtual domain configuration: disable
FIPS-CC mode: disable
Current HA mode: standalone
Distribution: International
Branch point: 632
Release Version Information: MR3 Patch 8
System time: Fri Nov 16 17:31:03 2012
|
Change the tunnel state
Bring up a vpn tunnel manually. No traffic required.
myfirewall # diag vpn tunnel up phase2-name phase1-name
|
Shut down a vpn tunnel manually.
myfirewall # diag vpn tunnel down phase2-name phase1-name
|
Check the tunnel state
If there is no SA that means the tunnel is down and does not work. To see if the tunnel is up we need to check if any SA exist.
To see if the tunnel is up you can use the diagnose vpn tunnel list name or diagnose vpn tunnel dumpsa command.
Tunnel state is down
Tunnel does not exist if there is no output of the commands below:
myfirewall1 # diagnose vpn tunnel list name myphase1
list ipsec tunnel by names in vd 0
|
with the dumpsa command:
myfirewall1 # diag vpn tunnel dumpsa
|
The output of the command below shows zero sa (no security association)
myfirewall3 # diagnose vpn tunnel stat
dev=1 tunnel=0 proxyid=1 sa=0 conc=0 up=0
|
Tunnel state is up
Informations from the output of the command below:
– vpn peers
– encrypted traffic (source and destination)
– traffic counters for encrypted traffic
– SPI for encrypt and decrypt
– Encryption method
In the following output the second tunnel with the name fortigw-311b-wlan-ph2 is down.
myfirewall # diagnose vpn tunnel list name fortigw-311b
list ipsec tunnel by names in vd 0
------------------------------------------------------
name=fortigw-311b ver=1 serial=1 2.2.2.2:0->1.1.1.1:0 lgwy=dyn tun=intf mode=auto bound_if=6
proxyid_num=2 child_num=0 refcnt=8 ilast=2 olast=2
stat: rxp=525048 txp=538908 rxb=276286832 txb=115110327
dpd: mode=active on=1 idle=5000ms retry=3 count=0 seqno=671422
natt: mode=none draft=0 interval=0 remote_port=0
proxyid=fortigw-311b-ph2 proto=0 sa=1 ref=2 auto_negotiate=0 serial=1
  src: 192.168.10.0/255.255.255.255:0
   dst: 0.0.0.0/0.0.0.0:0
  SA: ref=3 options=0000000e type=00 soft=0 mtu=1436 expire=1333 replaywin=1024 seqno=2c
  life: type=01 bytes=0/0 timeout=1750/1800
  dec: spi=5bafd6aa esp=3des key=24 8e4c7e9d5916fd00fc6f3fe4e7b35c40431735162c537049
    ah=sha1 key=20 2462eaec73cbfc473c9cc59c0b39d976dca8b15f
  enc: spi=2a05ad80 esp=3des key=24 83f2a4476675a7e810bb467ba0675222e6ad9f5db3ff4fed
    ah=sha1 key=20 3fdd10286ff936c3608879315bc3958d8112994e
proxyid=fortigw-311b-wlan-ph2 proto=0 sa=0 ref=1 auto_negotiate=0 serial=2
  src: 192.168.20.0/255.255.255.0:0
  dst: 0.0.0.0/0.0.0.0:0
|
In the following output the second tunnel with the name MyIPSecTunnnel is up.
myfirewall1 #  diagnose vpn tunnel list name "MyIPSecTunnnel"
list ipsec tunnel by names in vd 0
------------------------------------------------------
name=MyIPSecTunnnel ver=1 serial=1 3.3.3.3:0->4.4.3.48:0 lgwy=dyn tun=intf mode=auto bound_if=5
proxyid_num=1 child_num=0 refcnt=11 ilast=0 olast=0
stat: rxp=196 txp=335 rxb=57600 txb=28419
dpd: mode=active on=1 idle=5000ms retry=3 count=0 seqno=352
natt: mode=none draft=0 interval=0 remote_port=0
proxyid=MyIPSecTunnnel-ph2 proto=0 sa=1 ref=2 auto_negotiate=0 serial=1
  src: 0:192.168.224.64/255.255.255.224:0
  dst: 0:0.0.0.0/0.0.0.0:0
  SA: ref=3 options=0000000e type=00 soft=0 mtu=1436 expire=1657 replaywin=1024 seqno=2c
  life: type=01 bytes=0/0 timeout=1748/1800
  dec: spi=be8d94f1 esp=3des key=24 b7d4a72d2c79e1846d54133c4a198085cf22b6c500fc4064
       ah=sha1 key=20 0a6b3691b7a887d67b694935b813c7a0339e37d8
  enc: spi=9cc4bfdc esp=3des key=24 d77616bc3455f8acee018d5b9b572cbd087da9ff98e816ff
       ah=sha1 key=20 702f1d1572180f186fb169fef50d64f057281e7b
|
In this output are both tunnel up:
myfirewall1 # diag vpn tunnel dumpsa
---------------------------------
vf=0 tun=fortigw-311b
proxyid=fortigw-311b-wlan-ph2 proto=0
  src: 192.168.20.0/255.255.255.0:0
  dst: 0.0.0.0/0.0.0.0:0
  life: type=01 bytes=0/0 timeout=1750/1800
  dec: spi=5bafd6ac esp=3des key=24 944c6e0a4e52d578ce4a3f78f6066eae53ade0bf3aeca236
    ah=sha1 key=20 9c0ad72b08bf479e81d9109ac0f7f721c7040b46
  enc: spi=2a05ad97 esp=3des key=24 5c8141c750de92321c171b44c5473d82fbac47ae464f3107
    ah=sha1 key=20 0724b6b197c0cd157aced122bb6482d2d665e1b2
---------------------------------
vf=0 tun=fortigw-311b
proxyid=fortigw-311b-ph2 proto=0
  src: 192.168.10.0/255.255.255.0:0
  dst: 0.0.0.0/0.0.0.0:0
  life: type=01 bytes=0/0 timeout=1753/1800
  dec: spi=5bafd6ab esp=3des key=24 506055a1caf78cc42d645a94b226f37375eac8bb618efdc7
       ah=sha1 key=20 535c1f8ef20e8b7b6d011fdecfa955cef2085995
  enc: spi=2a05ad95 esp=3des key=24 1d710d27da29b773abdf3568200d3b4a2688fbc1fa72f43b
       ah=sha1 key=20 1d7d6b36084c715e8546369b621effaca60a5ee4
|
with the diagnose command:
myfirewall1 # diagnose vpn tunnel stat
dev=1 tunnel=0 proxyid=1 sa=1 conc=0 up=1
|
Check packet counters for the tunnel
To see if the encryption and decryption of the packages works use 2 or more times the diagnose vpn ipsec status or the diagnose vpn tunnel list command and compare the values. On the second and third outputs the counter should show larger number.
myfirewall1 # diagnose vpn ipsec status
All ipsec crypto devices in use:
CP6
        null:   0       0
        des:    0       0
        3des:   335     196
        aes:    0       0
        null:   0       0
        md5:    0       0
        sha1:   335     196
        sha256: 0       0
        sha384: 0       0
        sha512: 0       0
SOFTWARE:
        null:   0       0
        des:    0       0
        3des:   0       0
        aes:    0       0
        null:   0       0
        md5:    0       0
        sha1:   0       0
        sha256: 0       0
        sha384: 0       0
        sha512: 0       0
|
On the following output the firewall has 3 active vpn peers.
myfirewall1 # diag vpn tunnel list
list all ipsec tunnel in vd 0
------------------------------------------------------
name=soho-fw1 1.1.1.1:0->3.3.3.3:0 lgwy=dyn tun=intf mode=auto bound_if=7
proxyid_num=1 child_num=0 refcnt=5 ilast=4 olast=1
stat: rxp=1806451 txp=1447091 rxb=234325504 txb=499316955
dpd: mode=active on=1 idle=5000ms retry=3 count=0 seqno=3908556
natt: mode=none draft=0 interval=0 remote_port=0
proxyid=soho-fw1-p2 proto=0 sa=1 ref=2 auto_negotiate=0 serial=1
  src: 0.0.0.0/0.0.0.0:0
  dst: 192.168.40.0/255.255.255.0:0
  SA: ref=3 options=0000000e type=00 soft=0 mtu=1436 expire=366 replaywin=1024 seqno=c4
  life: type=01 bytes=0/0 timeout=1774/1800
  dec: spi=2a02fcf2 esp=3des key=24 b3f265d52c68528f65e622ecda7500049d8dc4c3f41dc1f0
       ah=sha1 key=20 846e4236a70d610c3848d8451d1423aa7a7a9b48
  enc: spi=bb50f13d esp=3des key=24 bb24fc093724e057e0de454f0be53554adcf8fb158569732
       ah=sha1 key=20 fdc777b8c11194e8245add02fbf402e4cac779fc
------------------------------------------------------
name=soho-fw2 1.1.1.1:0->4.4.4.4:0 lgwy=dyn tun=intf mode=auto bound_if=7
proxyid_num=1 child_num=0 refcnt=5 ilast=4 olast=4
stat: rxp=17110169 txp=18532534 rxb=5951742192 txb=15247163397
dpd: mode=active on=1 idle=5000ms retry=3 count=0 seqno=3450372
natt: mode=none draft=0 interval=0 remote_port=0
proxyid=soho-fw2-p2 proto=0 sa=1 ref=2 auto_negotiate=0 serial=1
  src: 0.0.0.0/0.0.0.0:0
  dst: 192.168.30.0/255.255.255.0:0
  SA: ref=3 options=0000000e type=00 soft=0 mtu=1436 expire=576 replaywin=1024 seqno=1063
  life: type=01 bytes=0/0 timeout=1774/1800
  dec: spi=2a02fcf3 esp=3des key=24 44b0afaf4fcbf8dbff067e1d75fc7222387efb4f434b4ab4
       ah=sha1 key=20 333e13671885e08177ea06df5ed88a941d60998c
  enc: spi=e5e804dc esp=3des key=24 f1bdc039431716a33761879a5b9ac0aca181ced2b363ca08
       ah=sha1 key=20 57a12c61b17f3431b1f8895045558ad408f7d356
------------------------------------------------------
name=soho-fw3 1.1.1.1:0->5.5.5.5:0 lgwy=dyn tun=intf mode=auto bound_if=7
|
5.0 sniffertrace
The basic command is “diagnose sniffer packet”, after that you have to define the interface* (or the keyword any):
myfirewall1 # diagnose sniffer packet
    the network interface to sniff (or "any")
|
*Looks like you cannot filter explicitly on tunnel interface, you have to use any in that case and define a filter string.
And the tcpdump like filter string (or the keyword none):
myfirewall1 # diagnose sniffer packet any
    flexible logical filters for sniffer (or "none").
For example:  To print udp 1812 traffic between forti1 and either forti2 or forti3
'udp and port 1812 and host forti1 and \( forti2 or forti3 \)'
|
And the output format you expect (I use always the 4)
myfirewall1 # diagnose sniffer packet any none

1: print header of packets
2: print header and data from ip of packets
3: print header and data from ethernet of packets (if available)
4: print header of packets with interface name
5: print header and data from ip of packets with interface name
6: print header and data from ethernet of packets (if available) with intf name

myfirewall1 # diagnose sniffer packet any none 4
    sniffer count

myfirewall1 # diagnose sniffer packet any none 4 4
interfaces=[any]
filters=[none]
0.914475 wan1 in 10.250.19.159.63929 -> 3.3.3.127.61784: 689103397 ack 64745307
0.915067 wan1 out 3.3.3.3.22 -> 10.20.100.10.57499: psh 3728577301 ack 1697425175
0.915079 eth0 out 3.3.3.3.22 -> 10.20.100.10.57499: psh 3728577301 ack 1697425175
0.915452 wan1 out 3.3.3.3.22 -> 10.20.100.10.57499: psh 3728577433 ack 1697425175
|
The 2. parameter after “…port6 arp 1? is the number of packets to be sniffered. In this example it is set to 2.
myfirewall # diagnose sniffer packet port6 arp 1 2
interfaces=[port6]
filters=[arp]
0.907592 arp who-has 3.3.3.3 tell 3.3.3.5
1.907597 arp who-has 3.3.3.3 tell 3.3.3.5
myfirewall #
|
If the sniffer should be analysed with Wireshark, the following pl script should be used:
fgt2eth.pl
6.0 View logging on cli
There are some fields that you wont ever see in webui as in the column setting you cannot choose them. Just an example for this is a false pre-shared key, the field that tells you what the problem is, called “error_reason”.
The buffer size is limited and if the buffer is full the old logs will be overwritten.
To check your buffer size issue the following command:
myfirewall # get log memory global-setting
full-final-warning-threshold: 95
full-first-warning-threshold: 75
full-second-warning-threshold: 90
max-size : 98304
|
Configure logging
To view the logs on the CLI issue the following commands (it is better to use a syslog server as checking the logs from memory, it is slow).
myfirewall # execute log filter device memory
myfirewall # execute log filter start-line 1
myfirewall # execute log filter view-lines 10
myfirewall # execute log filter category event
|
Check if that is correct for you.
myfirewall # execute log filter dump
category: event
device: memory
roll: 0
start-line: 1
view-lines: 10
|
Viewing the logs
In this example we can sse a failed vpn session as the preshared key is not identical on the vpn peers. The logs are not in every cases so talkative, for example the logs for different encryption traffic failure refer to nothing usefull.
Logs for preshared key failure:
myfirewall3 # execute log display
874 logs found.
10 logs returned.1: 2011-08-31 17:02:33 log_id=0101037127 type=event subtype=ipsec pri=notice fwver=040003 vd="root" msg="progress IPsec phase 1" action="negotiate" rem_ip=1.1.1.1 loc_ip=3.3.3.3 rem_port=500 loc_port=500 out_intf="wan1" cookies="26fb9f49765a425f/a1da24b19fb1f8ce" user="N/A" group="N/A" xauth_user="N/A" xauth_group="N/A" vpn_tunnel="fortigw-311b" status=success init=local mode=main dir=outbound stage=3 role=initiator result=OK2: 2011-08-31 17:02:33 log_id=0101037127 type=event subtype=ipsec pri=notice fwver=040003 vd="root" msg="progress IPsec phase 1" action="negotiate" rem_ip=1.1.1.1 loc_ip=3.3.3.3 rem_port=500 loc_port=500 out_intf="wan1" cookies="26fb9f49765a425f/a1da24b19fb1f8ce" user="N/A" group="N/A" xauth_user="N/A" xauth_group="N/A" vpn_tunnel="fortigw-311b" status=success init=local mode=main dir=outbound stage=2 role=initiator result=OK3: 2011-08-31 17:02:33 log_id=0101037127 type=event subtype=ipsec pri=notice fwver=040003 vd="root" msg="progress IPsec phase 1" action="negotiate" rem_ip=1.1.1.1 loc_ip=3.3.3.3 rem_port=500 loc_port=500 out_intf="wan1" cookies="26fb9f49765a425f/0000000000000000" user="N/A" group="N/A" xauth_user="N/A" xauth_group="N/A" vpn_tunnel="fortigw-311b" status=success init=local mode=main dir=outbound stage=1 role=initiator result=OK4: 2011-08-31 17:02:33 log_id=0101037128 type=event subtype=ipsec pri=error fwver=040003 vd="root" msg="progress IPsec phase 1" action="negotiate" rem_ip=1.1.1.1 loc_ip=3.3.3.3 rem_port=500 loc_port=500 out_intf="wan1" cookies="8cad3acdda13b8dc/49d8c9464e0a85e9" user="N/A" group="N/A" xauth_user="N/A" xauth_group="N/A" vpn_tunnel="fortigw-311b" status=failure init=remote mode=main dir=inbound stage=3 role=responder result=ERROR5: 2011-08-31 17:02:33 log_id=0101037124 type=event subtype=ipsec pri=error fwver=040003 vd="root" msg="IPsec phase 1 error" action="negotiate" rem_ip=1.1.1.1 loc_ip=3.3.3.3 rem_port=500 loc_port=500 out_intf="wan1" cookies="8cad3acdda13b8dc/49d8c9464e0a85e9" user="N/A" group="N/A" xauth_user="N/A" xauth_group="N/A" vpn_tunnel="fortigw-311b" status=negotiate_error error_reason=probable preshared key mismatch peer_notif=N/A6: 2011-08-31 17:02:31 log_id=0101037128 type=event subtype=ipsec pri=error fwver=040003 vd="root" msg="progress IPsec phase 1" action="negotiate" rem_ip=1.1.1.1 loc_ip=3.3.3.3 rem_port=500 loc_port=500 out_intf="wan1" cookies="8cad3acdda13b8dc/49d8c9464e0a85e9" user="N/A" group="N/A" xauth_user="N/A" xauth_group="N/A" vpn_tunnel="fortigw-311b" status=failure init=remote mode=main dir=inbound stage=3 role=responder result=ERROR7: 2011-08-31 17:02:31 log_id=0101037124 type=event subtype=ipsec pri=error fwver=040003 vd="root" msg="IPsec phase 1 error" action="negotiate" rem_ip=1.1.1.1 loc_ip=3.3.3.3 rem_port=500 loc_port=500 out_intf="wan1" cookies="8cad3acdda13b8dc/49d8c9464e0a85e9" user="N/A" group="N/A" xauth_user="N/A" xauth_group="N/A" vpn_tunnel="fortigw-311b" status=negotiate_error error_reason=probable preshared key mismatch peer_notif=N/A
|
Logs for different encryption traffic failure:
Sep 01 10:18:40 3.3.3.3 date=2011-09-01 time=10:18:40 devname=myfirewall3 device_id=FG200B1111111111 log_id=0101037129 type=event subtype=ipsec pri=notice fwver=040003 vd="root" msg="progress IPsec phase 2" action="negotiate" rem_ip=1.1.1.1 loc_ip=3.3.3.3 rem_port=500 loc_port=500 out_intf="wan1" cookies="2c4ea48ce0ad7bb5/1197f346a79b38b3" user="N/A" group="N/A" xauth_user="N/A" xauth_group="N/A" vpn_tunnel="fortigw-311b" status=success init=local mode=quick dir=outbound stage=1 role=initiator result=OK
Sep 01 10:19:36 3.3.3.3 date=2011-09-01 time=10:19:36 devname=myfirewall3 device_id=FG200B1111111111 log_id=0101037130 type=event subtype=ipsec pri=error fwver=040003 vd="root" msg="progress IPsec phase 2" action="negotiate" rem_ip=1.1.1.1 loc_ip=3.3.3.3 rem_port=500 loc_port=500 out_intf="wan1" cookies="2c4ea48ce0ad7bb5/1197f346a79b38b3" user="N/A" group="N/A" xauth_user="N/A" xauth_group="N/A" vpn_tunnel="fortigw-311b" status=failure init=remote mode=quick dir=inbound stage=1 role=responder result=ERROR
Sep 01 10:19:38 3.3.3.3 date=2011-09-01 time=10:19:38 devname=myfirewall3 device_id=FG200B1111111111 log_id=0101037130 type=event subtype=ipsec pri=error fwver=040003 vd="root" msg="progress IPsec phase 2" action="negotiate" rem_ip=1.1.1.1 loc_ip=3.3.3.3 rem_port=500 loc_port=500 out_intf="wan1" cookies="2c4ea48ce0ad7bb5/1197f346a79b38b3" user="N/A" group="N/A" xauth_user="N/A" xauth_group="N/A" vpn_tunnel="fortigw-311b" status=failure init=remote mode=quick dir=inbound stage=1 role=responder result=ERROR
Sep 01 10:19:42 3.3.3.3 date=2011-09-01 time=10:19:42 devname=myfirewall3 device_id=FG200B1111111111 log_id=0101037130 type=event subtype=ipsec pri=error fwver=040003 vd="root" msg="progress IPsec phase 2" action="negotiate" rem_ip=1.1.1.1 loc_ip=3.3.3.3 rem_port=500 loc_port=500 out_intf="wan1" cookies="2c4ea48ce0ad7bb5/1197f346a79b38b3" user="N/A" group="N/A" xauth_user="N/A" xauth_group="N/A" vpn_tunnel="fortigw-311b" status=failure init=remote mode=quick dir=inbound stage=1 role=responder result=ERROR
|
7.0 Backup and Restore
Backup command with tftp server:
myfirewall # execute backup full-config tftp <full-config-filename> <tftp server ip>
|
With an example:
myfirewall1 # execute backup full-config tftp myfirewall1_full_config 192.168.1.1
Please wait...
Connect to tftp server 192.168.1.1 ...
#
Send config file to tftp server OK.
myfirewall1 #
|
Restore command with tftp server:
myfirewall # execute restore config tftp <full-config-filename> <tftp server ip>
|
Example Restore:
myfirewall1 # execute restore config tftp myfirewall1_full_config 192.168.1.1
This operation will overwrite the current settings!
Do you want to continue? (y/n)yPlease wait...Connect to tftp server 192.168.1.1 ...Get config file from tftp server OK.
File check OK.The system is going down NOW !!
Please stand by while rebootinFGT200B (14:15-10.01.2008)
Ver:04000010
Serial number:FG200B1111111111
RAM activation
Total RAM: 256MB
Enabling cache...Done.
Scanning PCI bus...Done.
Allocating PCI resources...Done.
Enabling PCI resources...Done.
Zeroing IRQ settings...Done.
Verifying PIRQ tables...Done.
Enabling Interrupts...Done.
Boot up, boot device capacity: 64MB.
Press any key to display configuration menu...
......Reading boot image 1319595 bytes.
Initializing firewall...
System is started.
The config file may contain errors,
Please see details by the command 'diagnose debug config-error-log read'myfirewall1 login:
|
8.0 Other troubleshooting commands
1. List UTM settings from the command line. If VDOMs are not enabled just run the last line [Sameslug].
config vdom
edit ${VDOM_NAME}
show firewall policy
|
2. This will change a UTM IPS signatures from their default to ALL-PASS or ALL-BLOCK [Sameslug].
config vdom
edit ${VDOM_NAME}
config ips sensor <<< Start here if VDOMs are not enabled
edit ${UTM_IPS_NAME}
config entries
edit 1
set action [pass|block] <<< Here is where you choose to pass|block – use unset action for signature defaults.
end
end
end
|
 The page then goes on to provide instructions as to how to enable Flash, this basically consists of:
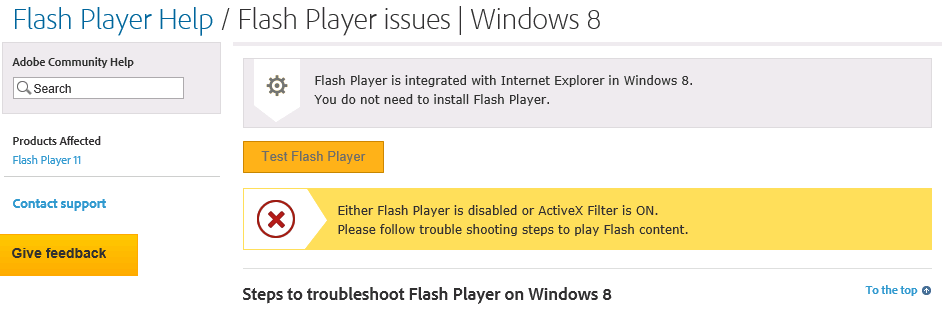 The page then goes on to provide instructions as to how to enable Flash, this basically consists of: